


chiffres clés
Ouverture :
31.600 €
Perf Ouverture :
+0.89 %
+ Haut :
31.980 €
+ Bas :
31.480 €
Clôture veille :
31.560 €
Volume :
446 422
Capi échangé :
+0.25 %
Capi :
5 719 M€
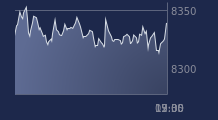
Graphique SCOR SE sur 5 jours
Cours SCOR SE sur 5 jours
| 06/07 | 07/07 | 08/07 | 09/07 | 10/07 | Date |
|---|---|---|---|---|---|
| 31.300(c) | 31.880(c) | 31.840(c) | 31.560(c) | 31.880(c) | Dernier |
| 0.00 % | +1.85 % | -0.13 % | -0.88 % | +1.01 % | Var. |
| 369 317 | 507 645 | 474 805 | 449 994 | 446 422 | Volume |
| 31.420 | 31.400 | 31.700 | 31.820 | 31.600 | Ouv. |
| 31.620 | 31.920 | 31.880 | 31.920 | 31.980 | + Haut |
| 31.260 | 31.360 | 31.260 | 31.460 | 31.480 | + Bas |
| 31.330 | 31.416 | 31.478 | 31.509 | 31.551 | MM20 |
| 31.279 | 31.286 | 31.284 | 31.290 | 31.293 | MM50 |
| 30.986 | 31.014 | 31.046 | 31.073 | 31.098 | MM100 |
Performances historiques SCOR SE
| 5 jours | 1 mois | 1er janvier | 5 ans |
|---|---|---|---|
| +1.85 % | +5.70 % | +10.93 % | +24.58 % |
Court terme
Neutre
Moyen terme
Haussière
Long terme
Haussière
Portefeuille Trading
+319.20 % vs +67.75 % pour le CAC 40
Performance depuis le 28 mai 2008