


chiffres clés
Ouverture :
7.490 €
Perf Ouverture :
+2.34 %
+ Haut :
7.725 €
+ Bas :
7.440 €
Clôture veille :
7.540 €
Volume :
67 665
Capi échangé :
+0.12 %
Capi :
430 M€
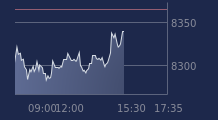
Graphique NEXITY sur 5 jours
Cours NEXITY sur 5 jours
| 08/07 | 09/07 | 10/07 | 13/07 | 14/07 | Date |
|---|---|---|---|---|---|
| 7.565(c) | 7.575(c) | 7.575(c) | 7.540(c) | 7.665 | Dernier |
| -4.90 % | +0.13 % | 0.00 % | -0.46 % | +1.66 % | Var. |
| 174 151 | 164 940 | 119 720 | 105 016 | 67 665 | Volume |
| 7.925 | 7.640 | 7.605 | 7.550 | 7.490 | Ouv. |
| 7.945 | 7.680 | 7.745 | 7.675 | 7.725 | + Haut |
| 7.565 | 7.435 | 7.575 | 7.505 | 7.440 | + Bas |
| 7.892 | 7.886 | 7.873 | 7.856 | 7.852 | MM20 |
| 8.104 | 8.092 | 8.075 | 8.056 | 8.041 | MM50 |
| 8.282 | 8.274 | 8.262 | 8.249 | 8.237 | MM100 |
Performances historiques NEXITY
| 5 jours | 1 mois | 1er janvier | 5 ans |
|---|---|---|---|
| -3.65 % | -2.11 % | -14.60 % | -82.10 % |
Court terme
Baissière
Moyen terme
Baissière
Long terme
Baissière
Portefeuille Trading
+320.20 % vs +67.85 % pour le CAC 40
Performance depuis le 28 mai 2008