


chiffres clés
Ouverture :
1 547.500 €
Perf Ouverture :
-1.03 %
+ Haut :
1 562.500 €
+ Bas :
1 516.000 €
Clôture veille :
1 550.500 €
Volume :
112 421
Capi échangé :
+0.11 %
Capi :
161 680 M€
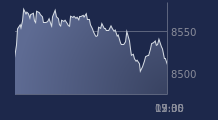
Graphique HERMES INTL sur 5 jours
Cours HERMES INTL sur 5 jours
| 27/07 | 28/07 | 29/07 | 30/07 | 31/07 | Date |
|---|---|---|---|---|---|
| 1659.000(c) | 1695.500(c) | 1508.500(c) | 1550.500(c) | 1531.500(c) | Dernier |
| +0.97 % | +2.20 % | -11.03 % | +2.78 % | -1.23 % | Var. |
| 75 670 | 94 646 | 427 914 | 133 161 | 112 421 | Volume |
| 1670.000 | 1680.000 | 1658.000 | 1502.500 | 1547.500 | Ouv. |
| 1690.500 | 1705.000 | 1660.500 | 1558.500 | 1562.500 | + Haut |
| 1658.500 | 1645.000 | 1465.500 | 1502.500 | 1516.000 | + Bas |
| 1645.850 | 1650.720 | 1646.400 | 1641.570 | 1636.100 | MM20 |
| 1642.780 | 1644.550 | 1642.280 | 1641.140 | 1639.670 | MM50 |
| 1673.390 | 1671.350 | 1667.380 | 1663.840 | 1659.680 | MM100 |
Performances historiques HERMES INTL
| 5 jours | 1 mois | 1er janvier | 5 ans |
|---|---|---|---|
| -6.79 % | -5.20 % | -27.83 % | +18.81 % |
Court terme
Baissière
Moyen terme
Baissière
Long terme
Baissière
Portefeuille Trading
+321.90 % vs +71.18 % pour le CAC 40
Performance depuis le 28 mai 2008