


chiffres clés
Ouverture :
8.880 €
Perf Ouverture :
+1.46 %
+ Haut :
9.055 €
+ Bas :
8.660 €
Clôture veille :
9.310 €
Volume :
263 859
Capi échangé :
+0.13 %
Capi :
1 813 M€
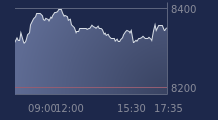
Graphique MAUREL ET PROM sur 5 jours
Cours MAUREL ET PROM sur 5 jours
| 08/06 | 09/06 | 10/06 | 11/06 | 12/06 | Date |
|---|---|---|---|---|---|
| 9.315(c) | 9.040(c) | 9.225(c) | 9.310(c) | 9.010(c) | Dernier |
| +0.81 % | -2.95 % | +2.05 % | +0.92 % | -3.22 % | Var. |
| 201 074 | 118 731 | 150 982 | 131 911 | 263 859 | Volume |
| 9.520 | 9.280 | 9.080 | 9.280 | 8.880 | Ouv. |
| 9.540 | 9.340 | 9.225 | 9.400 | 9.055 | + Haut |
| 9.200 | 9.035 | 8.960 | 9.260 | 8.660 | + Bas |
| 9.628 | 9.587 | 9.551 | 9.515 | 9.459 | MM20 |
| 9.737 | 9.713 | 9.694 | 9.671 | 9.635 | MM50 |
| 9.020 | 9.051 | 9.080 | 9.112 | 9.141 | MM100 |
Performances historiques MAUREL ET PROM
| 5 jours | 1 mois | 1er janvier | 5 ans |
|---|---|---|---|
| -2.49 % | -6.73 % | +63.08 % | +342.75 % |
Court terme
Neutre
Moyen terme
Baissière
Long terme
Neutre
Portefeuille Trading
+325.40 % vs +67.99 % pour le CAC 40
Performance depuis le 28 mai 2008