


chiffres clés
Ouverture :
20.950 €
Perf Ouverture :
-0.95 %
+ Haut :
21.250 €
+ Bas :
20.600 €
Clôture veille :
20.750 €
Volume :
20 285
Capi échangé :
+0.05 %
Capi :
823 M€
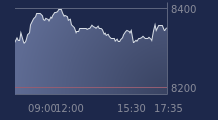
Graphique MANITOU BF sur 5 jours
Cours MANITOU BF sur 5 jours
| 08/06 | 09/06 | 10/06 | 11/06 | 12/06 | Date |
|---|---|---|---|---|---|
| 21.700(c) | 21.500(c) | 21.100(c) | 20.750(c) | 20.750(c) | Dernier |
| +1.64 % | -0.92 % | -1.86 % | -1.66 % | 0.00 % | Var. |
| 12 551 | 11 312 | 15 528 | 8 275 | 20 285 | Volume |
| 21.350 | 21.650 | 21.600 | 21.100 | 20.950 | Ouv. |
| 21.700 | 21.800 | 21.650 | 21.100 | 21.250 | + Haut |
| 21.050 | 21.400 | 21.000 | 20.600 | 20.600 | + Bas |
| 21.118 | 21.140 | 21.125 | 21.065 | 21.033 | MM20 |
| 20.929 | 20.974 | 21.019 | 21.057 | 21.085 | MM50 |
| 20.844 | 20.877 | 20.907 | 20.935 | 20.965 | MM100 |
Performances historiques MANITOU BF
| 5 jours | 1 mois | 1er janvier | 5 ans |
|---|---|---|---|
| -2.81 % | -2.35 % | +7.51 % | -24.27 % |
Court terme
Baissière
Moyen terme
Neutre
Long terme
Haussière
Portefeuille Trading
+325.40 % vs +67.99 % pour le CAC 40
Performance depuis le 28 mai 2008