


chiffres clés
Ouverture :
106.200 €
Perf Ouverture :
-0.66 %
+ Haut :
107.100 €
+ Bas :
105.500 €
Clôture veille :
107.000 €
Volume :
76 789
Capi échangé :
+0.08 %
Capi :
10 440 M€
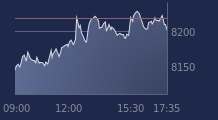
Graphique ADP sur 5 jours
Cours ADP sur 5 jours
| 03/06 | 04/06 | 05/06 | 08/06 | 09/06 | Date |
|---|---|---|---|---|---|
| 107.900(c) | 107.000(c) | 107.000(c) | 105.500(c) | - | Dernier |
| -1.28 % | -0.83 % | 0.00 % | -1.40 % | - | Var. |
| 111 451 | 63 420 | 101 505 | 76 789 | - | Volume |
| 109.100 | 108.100 | 107.000 | 106.200 | - | Ouv. |
| 110.100 | 108.700 | 108.100 | 107.100 | - | + Haut |
| 107.900 | 106.800 | 106.800 | 105.500 | - | + Bas |
| 108.825 | 108.770 | 108.790 | 108.785 | - | MM20 |
| 108.732 | 108.798 | 108.884 | 108.872 | - | MM50 |
| 110.249 | 110.173 | 110.141 | 110.101 | - | MM100 |
Performances historiques ADP
| 5 jours | 1 mois | 1er janvier | 5 ans |
|---|---|---|---|
| -6.88 % | -2.41 % | -5.30 % | -8.26 % |
Court terme
Baissière
Moyen terme
Baissière
Long terme
Baissière
Portefeuille Trading
+325.00 % vs +64.94 % pour le CAC 40
Performance depuis le 28 mai 2008