


chiffres clés
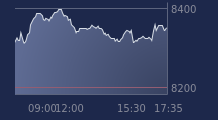
Ouverture :
81.0700 €
+ Haut :
82.7800 €
+ Bas :
81.0600 €
Perf Ouverture :
+1.65 %
Clôture veille :
79.0900 €
Volume :
88 781
Graphique LYXOR ETF SX50 DL sur 5 jours
Cours LYXOR ETF SX50 DL sur 5 jours
| 08/06 | 09/06 | 10/06 | 11/06 | 12/06 | Date |
|---|---|---|---|---|---|
| 79.2500(c) | 78.8800(c) | 77.9500(c) | 79.0900(c) | 82.4100(c) | Dernier |
| +0.06 % | -0.47 % | -1.18 % | +1.46 % | +4.20 % | Var. |
| 77.4600 | 79.6800 | 79.3200 | 78.3700 | 81.0700 | Ouv. |
| 79.8500 | 81.5200 | 79.3900 | 79.8700 | 82.7800 | + Haut |
| 77.4200 | 78.8800 | 76.9300 | 78.1300 | 81.0600 | + Bas |
| 77.5540 | 77.8575 | 78.0575 | 78.2140 | 78.6765 | MM20 |
| 74.5930 | 74.8576 | 75.1310 | 75.4090 | 75.7418 | MM50 |
| 74.5797 | 74.5873 | 74.5898 | 74.6293 | 74.7108 | MM100 |
Produit
Trackers
Type de produit
Leveraged
Sous-jacent
DOW JONES EURO S…
Type de sous-jacent
-
Emetteur
LYXOR ASSET MANAGEMENT
Portefeuille Trading
+325.40 % vs +67.99 % pour le CAC 40
Performance depuis le 28 mai 2008