


chiffres clés
Ouverture :
44.9300 €
+ Haut :
45.2200 €
+ Bas :
43.8300 €
Perf Ouverture :
-1.20 %
Clôture veille :
44.7750 €
Volume :
380 236
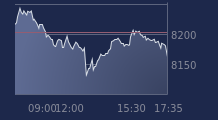
Graphique LYXOR ETF LEV CAC sur 5 jours
Cours LYXOR ETF LEV CAC sur 5 jours
| 04/06 | 05/06 | 08/06 | 09/06 | 10/06 | Date |
|---|---|---|---|---|---|
| 45.1650(c) | 44.9550(c) | 44.8000(c) | 44.7750(c) | 44.3900(c) | Dernier |
| +2.09 % | -0.46 % | -0.34 % | -0.06 % | -0.86 % | Var. |
| 44.3950 | 45.4000 | 44.1500 | 44.6800 | 44.9300 | Ouv. |
| 45.3500 | 45.7800 | 45.1000 | 45.7600 | 45.2200 | + Haut |
| 44.3950 | 44.9550 | 44.1000 | 44.6800 | 43.8300 | + Bas |
| 43.5938 | 43.6917 | 43.7940 | 43.9325 | 44.0378 | MM20 |
| 42.8492 | 42.9735 | 43.0747 | 43.1914 | 43.3143 | MM50 |
| 43.2398 | 43.2346 | 43.2295 | 43.2261 | 43.2251 | MM100 |
Produit
Trackers
Type de produit
Leveraged
Sous-jacent
CAC 40 LEVERAGE
Type de sous-jacent
-
Emetteur
LYXOR ASSET MANAGEMENT
Portefeuille Trading
+323.90 % vs +64.19 % pour le CAC 40
Performance depuis le 28 mai 2008