


chiffres clés
Ouverture :
446.1500 €
+ Haut :
448.8500 €
+ Bas :
445.7500 €
Perf Ouverture :
+0.20 %
Clôture veille :
450.6500 €
Volume :
775
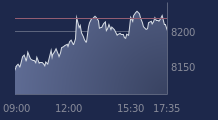
Graphique LYXOR ETF DJIA sur 5 jours
Cours LYXOR ETF DJIA sur 5 jours
| 03/06 | 04/06 | 05/06 | 08/06 | 09/06 | Date |
|---|---|---|---|---|---|
| 444.1500(c) | 449.4500(c) | 450.6500(c) | 447.0500(c) | - | Dernier |
| -0.37 % | +1.19 % | +0.27 % | -0.80 % | - | Var. |
| 447.0500 | 443.3500 | 449.6000 | 446.1500 | - | Ouv. |
| 447.0500 | 449.4500 | 451.4500 | 448.8500 | - | + Haut |
| 444.1500 | 443.3500 | 449.6000 | 445.7500 | - | + Bas |
| 435.6000 | 436.6520 | 437.8670 | 438.9000 | - | MM20 |
| 423.5080 | 424.4370 | 425.3740 | 426.1960 | - | MM50 |
| 421.4410 | 421.6650 | 421.9050 | 422.1340 | - | MM100 |
Produit
Trackers
Type de produit
Dow Jones
Sous-jacent
Type de sous-jacent
-
Emetteur
LYXOR A.M.
Portefeuille Trading
+325.00 % vs +64.94 % pour le CAC 40
Performance depuis le 28 mai 2008