


chiffres clés
Ouverture :
6.8350 €
+ Haut :
6.8460 €
+ Bas :
6.7680 €
Perf Ouverture :
-0.85 %
Clôture veille :
6.9280 €
Volume :
306 126
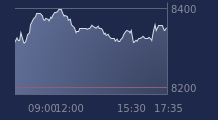
Graphique LYXOR ETF SX50 DS sur 5 jours
Cours LYXOR ETF SX50 DS sur 5 jours
| 08/06 | 09/06 | 10/06 | 11/06 | 12/06 | Date |
|---|---|---|---|---|---|
| 6.8960(c) | 6.9140(c) | 6.9510(c) | 6.9280(c) | 6.7770(c) | Dernier |
| -0.29 % | +0.26 % | +0.54 % | -0.33 % | -2.18 % | Var. |
| 6.9990 | 6.9010 | 6.9190 | 6.9550 | 6.8350 | Ouv. |
| 7.0000 | 6.9140 | 7.0110 | 6.9590 | 6.8460 | + Haut |
| 6.8960 | 6.8190 | 6.9190 | 6.9030 | 6.7680 | + Bas |
| 6.9969 | 6.9804 | 6.9684 | 6.9608 | 6.9394 | MM20 |
| 7.1649 | 7.1495 | 7.1334 | 7.1173 | 7.0997 | MM50 |
| 7.2024 | 7.2009 | 7.1995 | 7.1967 | 7.1919 | MM100 |
Produit
Trackers
Type de produit
SHORT EUROSTOXX 50
Sous-jacent
DOW JONES EURO S…
Type de sous-jacent
-
Emetteur
SGAM
Portefeuille Trading
+325.40 % vs +67.99 % pour le CAC 40
Performance depuis le 28 mai 2008