


chiffres clés
Ouverture :
6.9190 €
+ Haut :
7.0110 €
+ Bas :
6.9190 €
Perf Ouverture :
+0.46 %
Clôture veille :
6.9140 €
Volume :
285 942
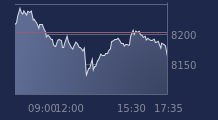
Graphique LYXOR ETF SX50 DS sur 5 jours
Cours LYXOR ETF SX50 DS sur 5 jours
| 04/06 | 05/06 | 08/06 | 09/06 | 10/06 | Date |
|---|---|---|---|---|---|
| 6.8860(c) | 6.9160(c) | 6.8960(c) | 6.9140(c) | 6.9510(c) | Dernier |
| -0.42 % | +0.44 % | -0.29 % | +0.26 % | +0.54 % | Var. |
| 6.9150 | 6.8900 | 6.9990 | 6.9010 | 6.9190 | Ouv. |
| 6.9200 | 6.9160 | 7.0000 | 6.9140 | 7.0110 | + Haut |
| 6.8820 | 6.8620 | 6.8960 | 6.8190 | 6.9190 | + Bas |
| 7.0195 | 7.0088 | 6.9969 | 6.9804 | 6.9684 | MM20 |
| 7.1930 | 7.1782 | 7.1649 | 7.1495 | 7.1334 | MM50 |
| 7.2063 | 7.2045 | 7.2024 | 7.2009 | 7.1995 | MM100 |
Produit
Trackers
Type de produit
SHORT EUROSTOXX 50
Sous-jacent
DOW JONES EURO S…
Type de sous-jacent
-
Emetteur
SGAM
Portefeuille Trading
+323.90 % vs +64.19 % pour le CAC 40
Performance depuis le 28 mai 2008