


chiffres clés
Ouverture :
24.000 €
Perf Ouverture :
-1.67 %
+ Haut :
24.000 €
+ Bas :
23.600 €
Clôture veille :
24.000 €
Volume :
132
Capi échangé :
+0.00 %
Capi :
862 M€
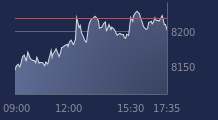
Graphique ALTAMIR sur 5 jours
Cours ALTAMIR sur 5 jours
| 03/06 | 04/06 | 05/06 | 08/06 | 09/06 | Date |
|---|---|---|---|---|---|
| 23.500(c) | 23.900(c) | 24.000(c) | 23.600(c) | - | Dernier |
| 0.00 % | +1.70 % | +0.42 % | -1.67 % | - | Var. |
| 60 | 111 | 17 | 132 | - | Volume |
| 23.600 | 23.500 | 24.100 | 24.000 | - | Ouv. |
| 23.700 | 24.100 | 24.100 | 24.000 | - | + Haut |
| 23.500 | 23.500 | 24.000 | 23.600 | - | + Bas |
| 23.690 | 23.685 | 23.685 | 23.660 | - | MM20 |
| 24.164 | 24.119 | 24.095 | 24.063 | - | MM50 |
| 26.376 | 26.316 | 26.258 | 26.197 | - | MM100 |
Performances historiques ALTAMIR
| 5 jours | 1 mois | 1er janvier | 5 ans |
|---|---|---|---|
| -2.07 % | -1.67 % | -21.33 % | -1.63 % |
Court terme
Neutre
Moyen terme
Baissière
Long terme
Baissière
Pas de conseil sur cette valeur
Portefeuille Trading
+325.00 % vs +64.94 % pour le CAC 40
Performance depuis le 28 mai 2008