


chiffres clés
Ouverture :
37.000 €
Perf Ouverture :
-3.24 %
+ Haut :
37.000 €
+ Bas :
35.700 €
Clôture veille :
37.000 €
Volume :
1 489
Capi échangé :
+0.02 %
Capi :
263 M€
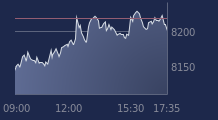
Graphique DELTA PLUS GROUP sur 5 jours
Cours DELTA PLUS GROUP sur 5 jours
| 03/06 | 04/06 | 05/06 | 08/06 | 09/06 | Date |
|---|---|---|---|---|---|
| 37.300(c) | 36.800(c) | 37.000(c) | 35.800(c) | - | Dernier |
| +0.81 % | -1.34 % | +0.54 % | -3.24 % | - | Var. |
| 395 | 1 693 | 2 434 | 1 489 | - | Volume |
| 37.000 | 37.200 | 37.000 | 37.000 | - | Ouv. |
| 37.300 | 37.300 | 37.300 | 37.000 | - | + Haut |
| 36.800 | 36.600 | 36.400 | 35.700 | - | + Bas |
| 37.900 | 37.605 | 37.330 | 37.050 | - | MM20 |
| 40.492 | 40.404 | 40.306 | 40.182 | - | MM50 |
| 44.362 | 44.238 | 44.118 | 43.987 | - | MM100 |
Performances historiques DELTA PLUS GROUP
| 5 jours | 1 mois | 1er janvier | 5 ans |
|---|---|---|---|
| -5.29 % | -16.16 % | -27.38 % | -54.74 % |
Court terme
Baissière
Moyen terme
Baissière
Long terme
Baissière
Pas de conseil sur cette valeur
Portefeuille Trading
+325.00 % vs +64.94 % pour le CAC 40
Performance depuis le 28 mai 2008