


chiffres clés
Ouverture :
49.890 €
Perf Ouverture :
-1.38 %
+ Haut :
50.580 €
+ Bas :
48.860 €
Clôture veille :
50.160 €
Volume :
1 250 350
Capi échangé :
+0.32 %
Capi :
19 012 M€
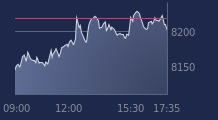
Graphique BOUYGUES sur 5 jours
Cours BOUYGUES sur 5 jours
| 03/06 | 04/06 | 05/06 | 08/06 | 09/06 | Date |
|---|---|---|---|---|---|
| 49.610(c) | 49.810(c) | 50.160(c) | 49.200(c) | - | Dernier |
| +0.40 % | +0.40 % | +0.70 % | -1.91 % | - | Var. |
| 851 236 | 832 156 | 616 071 | 1 250 350 | - | Volume |
| 49.040 | 49.600 | 50.100 | 49.890 | - | Ouv. |
| 49.730 | 50.200 | 50.560 | 50.580 | - | + Haut |
| 49.000 | 48.870 | 50.100 | 48.860 | - | + Bas |
| 50.248 | 50.186 | 50.182 | 50.096 | - | MM20 |
| 50.736 | 50.747 | 50.759 | 50.741 | - | MM50 |
| 49.543 | 49.586 | 49.641 | 49.681 | - | MM100 |
Performances historiques BOUYGUES
| 5 jours | 1 mois | 1er janvier | 5 ans |
|---|---|---|---|
| -0.99 % | -3.64 % | +10.94 % | +45.30 % |
Court terme
Baissière
Moyen terme
Baissière
Long terme
Neutre
Portefeuille Trading
+325.00 % vs +64.94 % pour le CAC 40
Performance depuis le 28 mai 2008