


chiffres clés
Ouverture :
8.300 €
Perf Ouverture :
-3.37 %
+ Haut :
8.310 €
+ Bas :
8.020 €
Clôture veille :
8.280 €
Volume :
34 810
Capi échangé :
+0.11 %
Capi :
262 M€
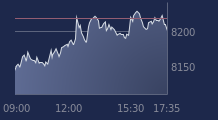
Graphique BONDUELLE sur 5 jours
Cours BONDUELLE sur 5 jours
| 03/06 | 04/06 | 05/06 | 08/06 | 09/06 | Date |
|---|---|---|---|---|---|
| 8.220(c) | 8.270(c) | 8.280(c) | 8.020(c) | - | Dernier |
| -0.12 % | +0.61 % | +0.12 % | -3.14 % | - | Var. |
| 9 446 | 4 447 | 22 776 | 34 810 | - | Volume |
| 8.250 | 8.190 | 8.280 | 8.300 | - | Ouv. |
| 8.290 | 8.280 | 8.410 | 8.310 | - | + Haut |
| 8.130 | 8.150 | 8.150 | 8.020 | - | + Bas |
| 8.157 | 8.163 | 8.167 | 8.164 | - | MM20 |
| 8.421 | 8.420 | 8.421 | 8.415 | - | MM50 |
| 9.106 | 9.091 | 9.073 | 9.053 | - | MM100 |
Performances historiques BONDUELLE
| 5 jours | 1 mois | 1er janvier | 5 ans |
|---|---|---|---|
| -1.35 % | -1.72 % | -23.62 % | -64.20 % |
Court terme
Baissière
Moyen terme
Baissière
Long terme
Baissière
Portefeuille Trading
+325.00 % vs +64.94 % pour le CAC 40
Performance depuis le 28 mai 2008