


chiffres clés
Ouverture :
7.610 €
Perf Ouverture :
+1.91 %
+ Haut :
7.850 €
+ Bas :
7.600 €
Clôture veille :
7.685 €
Volume :
126 492
Capi échangé :
+0.23 %
Capi :
435 M€
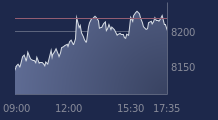
Graphique NEXITY sur 5 jours
Cours NEXITY sur 5 jours
| 03/06 | 04/06 | 05/06 | 08/06 | 09/06 | Date |
|---|---|---|---|---|---|
| 7.645(c) | 7.850(c) | 7.685(c) | 7.755(c) | - | Dernier |
| -3.90 % | +2.68 % | -2.10 % | +0.91 % | - | Var. |
| 281 803 | 105 075 | 118 629 | 126 492 | - | Volume |
| 7.980 | 7.700 | 7.845 | 7.610 | - | Ouv. |
| 8.010 | 7.855 | 7.940 | 7.850 | - | + Haut |
| 7.635 | 7.700 | 7.675 | 7.600 | - | + Bas |
| 8.325 | 8.273 | 8.219 | 8.166 | - | MM20 |
| 8.416 | 8.416 | 8.412 | 8.409 | - | MM50 |
| 8.553 | 8.544 | 8.534 | 8.524 | - | MM100 |
Performances historiques NEXITY
| 5 jours | 1 mois | 1er janvier | 5 ans |
|---|---|---|---|
| -3.60 % | -12.72 % | -13.59 % | -81.91 % |
Court terme
Baissière
Moyen terme
Baissière
Long terme
Baissière
Portefeuille Trading
+325.00 % vs +64.94 % pour le CAC 40
Performance depuis le 28 mai 2008