


chiffres clés
Ouverture :
19.455 €
Perf Ouverture :
0.00 %
+ Haut :
19.500 €
+ Bas :
19.360 €
Clôture veille :
19.355 €
Volume :
24 887
Capi échangé :
+0.01 %
Capi :
4 559 M€
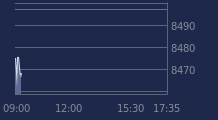
Graphique VALLOUREC sur 5 jours
Cours VALLOUREC sur 5 jours
| 18/02 | 19/02 | 20/02 | 23/02 | 24/02 | Date |
|---|---|---|---|---|---|
| 19.010(c) | 19.605(c) | 19.310(c) | 19.355(c) | 19.480 | Dernier |
| +1.22 % | +3.13 % | -1.50 % | +0.23 % | +0.65 % | Var. |
| 436 671 | 1 007 210 | 551 778 | 911 156 | 24 214 | Volume |
| 18.900 | 19.205 | 19.505 | 19.445 | 19.455 | Ouv. |
| 19.150 | 19.820 | 19.650 | 19.505 | 19.480 | + Haut |
| 18.880 | 19.040 | 19.205 | 19.220 | 19.360 | + Bas |
| 18.266 | 18.363 | 18.429 | 18.523 | 18.616 | MM20 |
| 16.985 | 17.066 | 17.142 | 17.222 | 17.305 | MM50 |
| 16.540 | 16.573 | 16.604 | 16.630 | 16.658 | MM100 |
Performances historiques VALLOUREC
| 5 jours | 1 mois | 1er janvier | 5 ans |
|---|---|---|---|
| +3.59 % | +8.17 % | +24.00 % | +63.52 % |
Court terme
Haussière
Moyen terme
Haussière
Long terme
Haussière
Portefeuille Trading
+335.50 % vs +70.78 % pour le CAC 40
Performance depuis le 28 mai 2008