


chiffres clés
Ouverture :
102.800 €
Perf Ouverture :
-0.29 %
+ Haut :
103.650 €
+ Bas :
102.100 €
Clôture veille :
102.450 €
Volume :
170 750
Capi échangé :
+0.12 %
Capi :
14 805 M€
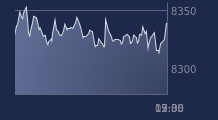
Graphique UNIBAIL-RODAMCO-WESTFIELD sur 5 jours
Cours UNIBAIL-RODAMCO-WESTFIELD sur 5 jours
| 06/07 | 07/07 | 08/07 | 09/07 | 10/07 | Date |
|---|---|---|---|---|---|
| 102.550(c) | 103.100(c) | 100.750(c) | 102.450(c) | 102.500(c) | Dernier |
| -0.58 % | +0.54 % | -2.28 % | +1.69 % | +0.05 % | Var. |
| 133 911 | 190 919 | 271 463 | 201 479 | 170 750 | Volume |
| 103.400 | 102.400 | 102.500 | 102.250 | 102.800 | Ouv. |
| 103.600 | 103.300 | 102.550 | 102.600 | 103.650 | + Haut |
| 102.350 | 102.300 | 100.400 | 101.350 | 102.100 | + Bas |
| 100.950 | 101.230 | 101.317 | 101.453 | 101.543 | MM20 |
| 100.199 | 100.195 | 100.132 | 100.130 | 100.118 | MM50 |
| 100.044 | 100.084 | 100.097 | 100.116 | 100.106 | MM100 |
Performances historiques UNIBAIL-RODAMCO-WESTFIELD
| 5 jours | 1 mois | 1er janvier | 5 ans |
|---|---|---|---|
| -0.63 % | +5.13 % | +10.50 % | +35.89 % |
Court terme
Neutre
Moyen terme
Neutre
Long terme
Baissière
Portefeuille Trading
+319.20 % vs +67.75 % pour le CAC 40
Performance depuis le 28 mai 2008