


chiffres clés
Ouverture :
-
Perf Ouverture :
-
+ Haut :
-
+ Bas :
-
Clôture veille :
17.000 €
Volume :
-
Capi échangé :
-
Capi :
1 114 M€
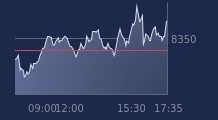
Graphique TARKETT sur 5 jours
Cours TARKETT sur 5 jours
| 08/07 | 09/07 | 10/07 | 13/07 | 14/07 | Date |
|---|---|---|---|---|---|
| - | - | - | - | - | Dernier |
| - | - | - | - | - | Var. |
| - | - | - | - | - | Volume |
| - | - | - | - | - | Ouv. |
| - | - | - | - | - | + Haut |
| - | - | - | - | - | + Bas |
| - | - | - | - | - | MM20 |
| - | - | - | - | - | MM50 |
| - | - | - | - | - | MM100 |
Performances historiques TARKETT
| 5 jours | 1 mois | 1er janvier | 5 ans |
|---|---|---|---|
| 0.00 % | +2.41 % | +61.90 % | +13.33 % |
Court terme
Haussière
Moyen terme
Haussière
Long terme
Haussière
Portefeuille Trading
+320.20 % vs +68.27 % pour le CAC 40
Performance depuis le 28 mai 2008