


chiffres clés
Ouverture :
27.100 €
Perf Ouverture :
0.00 %
+ Haut :
27.100 €
+ Bas :
27.100 €
Clôture veille :
27.100 €
Volume :
31
Capi échangé :
+0.00 %
Capi :
660 M€
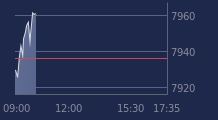
Graphique SYNERGIE sur 5 jours
Cours SYNERGIE sur 5 jours
| 11/03 | 12/03 | 13/03 | 16/03 | 17/03 | Date |
|---|---|---|---|---|---|
| 27.000(c) | 27.100(c) | 27.100(c) | 27.100(c) | 27.100 | Dernier |
| -1.10 % | +0.37 % | 0.00 % | 0.00 % | 0.00 % | Var. |
| 2 518 | 999 | 24 | 779 | 31 | Volume |
| 27.300 | 27.000 | 27.100 | 27.100 | 27.100 | Ouv. |
| 27.400 | 27.100 | 27.200 | 27.200 | 27.100 | + Haut |
| 26.800 | 26.900 | 27.100 | 27.100 | 27.100 | + Bas |
| 28.725 | 28.585 | 28.470 | 28.350 | 28.220 | MM20 |
| 29.638 | 29.576 | 29.512 | 29.452 | 29.386 | MM50 |
| 30.830 | 30.777 | 30.729 | 30.682 | 30.627 | MM100 |
Performances historiques SYNERGIE
| 5 jours | 1 mois | 1er janvier | 5 ans |
|---|---|---|---|
| -0.73 % | -8.14 % | -10.26 % | -10.56 % |
Court terme
Baissière
Moyen terme
Baissière
Long terme
Baissière
Portefeuille Trading
+334.90 % vs +60.14 % pour le CAC 40
Performance depuis le 28 mai 2008