


chiffres clés
Ouverture :
6.800 €
Perf Ouverture :
+1.99 %
+ Haut :
6.958 €
+ Bas :
6.695 €
Clôture veille :
6.784 €
Volume :
4 165 740
Capi échangé :
+0.14 %
Capi :
20 137 M€
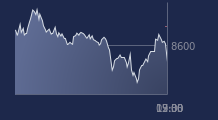
Graphique STELLANTIS sur 5 jours
Cours STELLANTIS sur 5 jours
| 23/02 | 24/02 | 25/02 | 26/02 | 27/02 | Date |
|---|---|---|---|---|---|
| 6.470(c) | 6.596(c) | 6.508(c) | 6.784(c) | 6.935(c) | Dernier |
| -1.37 % | +1.95 % | -1.33 % | +4.24 % | +2.23 % | Var. |
| 2 943 750 | 3 096 850 | 2 593 710 | 6 773 570 | 4 165 740 | Volume |
| 6.518 | 6.520 | 6.620 | 6.500 | 6.800 | Ouv. |
| 6.567 | 6.674 | 6.642 | 6.954 | 6.958 | + Haut |
| 6.428 | 6.520 | 6.508 | 6.417 | 6.695 | + Bas |
| 7.200 | 7.122 | 7.039 | 6.973 | 6.905 | MM20 |
| 8.408 | 8.340 | 8.269 | 8.203 | 8.139 | MM50 |
| 8.767 | 8.745 | 8.720 | 8.695 | 8.670 | MM100 |
Performances historiques STELLANTIS
| 5 jours | 1 mois | 1er janvier | 5 ans |
|---|---|---|---|
| +5.72 % | -14.65 % | -26.22 % | -48.34 % |
Court terme
Neutre
Moyen terme
Baissière
Long terme
Baissière
Portefeuille Trading
+334.30 % vs +72.61 % pour le CAC 40
Performance depuis le 28 mai 2008