


chiffres clés
Ouverture :
6.370 €
Perf Ouverture :
+3.45 %
+ Haut :
6.590 €
+ Bas :
6.330 €
Clôture veille :
6.415 €
Volume :
38 936
Capi échangé :
+0.01 %
Capi :
2 527 M€
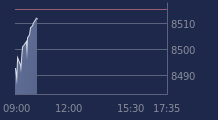
Graphique SES sur 5 jours
Cours SES sur 5 jours
| 17/02 | 18/02 | 19/02 | 20/02 | 23/02 | Date |
|---|---|---|---|---|---|
| 6.595(c) | 6.500(c) | 6.500(c) | 6.415(c) | 6.590 | Dernier |
| +0.23 % | -1.44 % | 0.00 % | -1.31 % | +2.73 % | Var. |
| 251 211 | 489 043 | 685 867 | 390 079 | 38 936 | Volume |
| 6.590 | 6.620 | 6.460 | 6.460 | 6.370 | Ouv. |
| 6.625 | 6.620 | 6.500 | 6.490 | 6.590 | + Haut |
| 6.465 | 6.460 | 6.300 | 6.370 | 6.330 | + Bas |
| 6.650 | 6.644 | 6.647 | 6.643 | 6.649 | MM20 |
| 6.106 | 6.126 | 6.150 | 6.170 | 6.193 | MM50 |
| 6.064 | 6.066 | 6.066 | 6.066 | 6.065 | MM100 |
Performances historiques SES
| 5 jours | 1 mois | 1er janvier | 5 ans |
|---|---|---|---|
| +0.15 % | +2.41 % | +19.17 % | -4.38 % |
Court terme
Baissière
Moyen terme
Neutre
Long terme
Neutre
Portefeuille Trading
+335.80 % vs +71.27 % pour le CAC 40
Performance depuis le 28 mai 2008