


chiffres clés
Ouverture :
21.840 €
Perf Ouverture :
-0.23 %
+ Haut :
22.380 €
+ Bas :
21.560 €
Clôture veille :
21.830 €
Volume :
891 127
Capi échangé :
+0.51 %
Capi :
3 835 M€
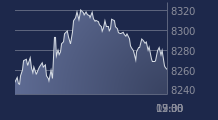
Graphique RANDSTAD sur 5 jours
Cours RANDSTAD sur 5 jours
| 02/04 | 07/04 | 08/04 | 09/04 | 10/04 | Date |
|---|---|---|---|---|---|
| 22.420(c) | 22.390(c) | 22.580(c) | 21.830(c) | 21.790(c) | Dernier |
| -0.80 % | -0.13 % | +0.85 % | -3.32 % | -0.18 % | Var. |
| 701 378 | 717 955 | 1 227 300 | 973 892 | 891 127 | Volume |
| 22.320 | 22.590 | 23.600 | 22.440 | 21.840 | Ouv. |
| 22.530 | 22.880 | 23.750 | 22.540 | 22.380 | + Haut |
| 22.110 | 22.220 | 22.410 | 21.650 | 21.560 | + Bas |
| 24.473 | 24.251 | 24.064 | 23.851 | 23.635 | MM20 |
| 26.771 | 26.641 | 26.518 | 26.393 | 26.262 | MM50 |
| 29.469 | 29.349 | 29.228 | 29.099 | 28.977 | MM100 |
Performances historiques RANDSTAD
| 5 jours | 1 mois | 1er janvier | 5 ans |
|---|---|---|---|
| -2.81 % | -17.18 % | -32.68 % | -65.69 % |
Court terme
Baissière
Moyen terme
Baissière
Long terme
Baissière
Pas de conseil sur cette valeur
Portefeuille Trading
+332.70 % vs +66.15 % pour le CAC 40
Performance depuis le 28 mai 2008