


chiffres clés
Ouverture :
15.250 €
Perf Ouverture :
-5.11 %
+ Haut :
15.420 €
+ Bas :
14.470 €
Clôture veille :
15.250 €
Volume :
123 056
Capi échangé :
+0.08 %
Capi :
2 194 M€
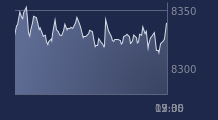
Graphique OVHCLOUD sur 5 jours
Cours OVHCLOUD sur 5 jours
| 06/07 | 07/07 | 08/07 | 09/07 | 10/07 | Date |
|---|---|---|---|---|---|
| 16.640(c) | 16.800(c) | 15.080(c) | 15.250(c) | 14.470(c) | Dernier |
| +7.84 % | +0.96 % | -10.24 % | +1.13 % | -5.11 % | Var. |
| 159 208 | 210 866 | 148 694 | 110 856 | 123 056 | Volume |
| 15.430 | 16.430 | 16.630 | 15.200 | 15.250 | Ouv. |
| 16.650 | 17.650 | 16.630 | 15.550 | 15.420 | + Haut |
| 15.430 | 16.400 | 14.820 | 14.790 | 14.470 | + Bas |
| 15.558 | 15.652 | 15.657 | 15.667 | 15.603 | MM20 |
| 13.809 | 13.937 | 14.032 | 14.127 | 14.208 | MM50 |
| 11.540 | 11.614 | 11.673 | 11.736 | 11.791 | MM100 |
Performances historiques OVHCLOUD
| 5 jours | 1 mois | 1er janvier | 5 ans |
|---|---|---|---|
| -6.22 % | -3.02 % | +98.49 % | 0.00 % |
Court terme
Neutre
Moyen terme
Neutre
Long terme
Haussière
Portefeuille Trading
+319.20 % vs +67.75 % pour le CAC 40
Performance depuis le 28 mai 2008