


Ouverture :
-
Perf Ouverture :
-
+ Haut :
-
+ Bas :
-
Clôture veille :
0.060 €
Volume :
-
Capi échangé :
-
Capi :
6 M€
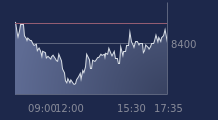
Graphique NEOLIFE sur 5 jours
Cours NEOLIFE sur 5 jours
| 17/06 | 18/06 | 19/06 | 22/06 | 23/06 | Date |
|---|---|---|---|---|---|
| 0.069(c) | 0.070(c) | 0.060(c) | 0.062(c) | - | Dernier |
| -7.03 % | +1.16 % | -13.79 % | +3.00 % | - | Var. |
| 541 260 | 876 218 | 360 133 | 335 798 | - | Volume |
| 0.074 | 0.066 | 0.069 | 0.059 | - | Ouv. |
| 0.074 | 0.070 | 0.069 | 0.066 | - | + Haut |
| 0.067 | 0.064 | 0.060 | 0.059 | - | + Bas |
| 0.069 | 0.071 | 0.072 | 0.072 | - | MM20 |
| 0.054 | 0.054 | 0.054 | 0.055 | - | MM50 |
| 0.054 | 0.054 | 0.054 | 0.055 | - | MM100 |
Performances historiques NEOLIFE
| 5 jours | 1 mois | 1er janvier | 5 ans |
|---|---|---|---|
| -21.37 % | +58.46 % | +21.65 % | -80.16 % |
Court terme
Neutre
Moyen terme
Haussière
Long terme
Haussière
Pas de conseil sur cette valeur
Portefeuille Trading
+322.30 % vs +68.98 % pour le CAC 40
Performance depuis le 28 mai 2008