


chiffres clés
Ouverture :
0.052 €
Perf Ouverture :
+1.15 %
+ Haut :
0.053 €
+ Bas :
0.051 €
Clôture veille :
0.051 €
Volume :
5 545
Capi échangé :
+0.01 %
Capi :
5 M€
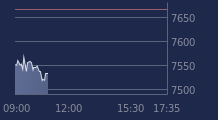
Graphique NEOLIFE sur 5 jours
Cours NEOLIFE sur 5 jours
| 17/03 | 18/03 | 19/03 | 20/03 | 23/03 | Date |
|---|---|---|---|---|---|
| 0.053(c) | 0.051(c) | 0.051(c) | 0.051(c) | 0.053 | Dernier |
| +0.38 % | -4.17 % | +0.79 % | -0.39 % | +4.33 % | Var. |
| 24 | 102 045 | 2 039 | 7 379 | 5 545 | Volume |
| 0.053 | 0.053 | 0.053 | 0.051 | 0.052 | Ouv. |
| 0.053 | 0.053 | 0.053 | 0.052 | 0.053 | + Haut |
| 0.053 | 0.051 | 0.051 | 0.051 | 0.051 | + Bas |
| 0.055 | 0.055 | 0.055 | 0.054 | 0.054 | MM20 |
| 0.055 | 0.055 | 0.055 | 0.055 | 0.055 | MM50 |
| 0.056 | 0.056 | 0.056 | 0.055 | 0.055 | MM100 |
Performances historiques NEOLIFE
| 5 jours | 1 mois | 1er janvier | 5 ans |
|---|---|---|---|
| +0.76 % | -12.83 % | +4.33 % | -87.59 % |
Court terme
Baissière
Moyen terme
Baissière
Long terme
Baissière
Pas de conseil sur cette valeur
Portefeuille Trading
+336.60 % vs +51.36 % pour le CAC 40
Performance depuis le 28 mai 2008