


chiffres clés
Ouverture :
26.060 €
Perf Ouverture :
-1.84 %
+ Haut :
26.880 €
+ Bas :
25.340 €
Clôture veille :
25.680 €
Volume :
141 634
Capi échangé :
+0.29 %
Capi :
1 238 M€
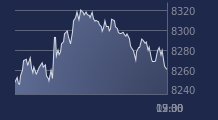
Graphique NANOBIOTIX sur 5 jours
Cours NANOBIOTIX sur 5 jours
| 02/04 | 07/04 | 08/04 | 09/04 | 10/04 | Date |
|---|---|---|---|---|---|
| 27.400(c) | 25.620(c) | 25.880(c) | 25.680(c) | 25.580(c) | Dernier |
| -5.35 % | -6.50 % | +1.01 % | -0.77 % | -0.39 % | Var. |
| 247 846 | 202 946 | 259 050 | 151 177 | 141 634 | Volume |
| 28.150 | 27.260 | 26.980 | 25.900 | 26.060 | Ouv. |
| 28.550 | 27.260 | 27.100 | 26.060 | 26.880 | + Haut |
| 26.200 | 25.180 | 25.600 | 25.040 | 25.340 | + Bas |
| 27.983 | 27.831 | 27.450 | 27.092 | 26.921 | MM20 |
| 23.905 | 24.061 | 24.215 | 24.357 | 24.504 | MM50 |
| 21.165 | 21.242 | 21.316 | 21.395 | 21.469 | MM100 |
Performances historiques NANOBIOTIX
| 5 jours | 1 mois | 1er janvier | 5 ans |
|---|---|---|---|
| -6.64 % | -23.64 % | +31.18 % | +84.96 % |
Court terme
Baissière
Moyen terme
Neutre
Long terme
Haussière
Portefeuille Trading
+332.70 % vs +66.15 % pour le CAC 40
Performance depuis le 28 mai 2008