


chiffres clés
Ouverture :
33.960 €
Perf Ouverture :
+4.71 %
+ Haut :
37.160 €
+ Bas :
33.960 €
Clôture veille :
34.100 €
Volume :
196 106
Capi échangé :
+0.39 %
Capi :
1 800 M€
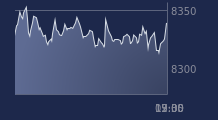
Graphique NANOBIOTIX sur 5 jours
Cours NANOBIOTIX sur 5 jours
| 06/07 | 07/07 | 08/07 | 09/07 | 10/07 | Date |
|---|---|---|---|---|---|
| 35.180(c) | 33.100(c) | 33.420(c) | 34.100(c) | 35.560(c) | Dernier |
| +0.80 % | -5.91 % | +0.97 % | +2.03 % | +4.28 % | Var. |
| 124 099 | 188 643 | 101 914 | 37 997 | 196 106 | Volume |
| 34.900 | 36.080 | 32.660 | 33.920 | 33.960 | Ouv. |
| 35.580 | 36.240 | 34.600 | 34.360 | 37.160 | + Haut |
| 33.740 | 32.520 | 32.100 | 33.160 | 33.960 | + Bas |
| 31.154 | 31.369 | 31.626 | 31.881 | 32.129 | MM20 |
| 33.329 | 33.424 | 33.526 | 33.643 | 33.780 | MM50 |
| 29.825 | 29.951 | 30.077 | 30.205 | 30.338 | MM100 |
Performances historiques NANOBIOTIX
| 5 jours | 1 mois | 1er janvier | 5 ans |
|---|---|---|---|
| +1.89 % | +23.47 % | +82.36 % | +187.94 % |
Court terme
Haussière
Moyen terme
Haussière
Long terme
Haussière
Portefeuille Trading
+319.20 % vs +67.75 % pour le CAC 40
Performance depuis le 28 mai 2008