chiffres clés
Ouverture :
0.4791 €
+ Haut :
0.4851 €
+ Bas :
0.4780 €
Perf Ouverture :
+1.25 %
Clôture veille :
0.4851 €
Volume :
179 800
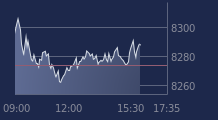
Graphique LYXOR ETF SX50 DDS sur 5 jours
Cours LYXOR ETF SX50 DDS sur 5 jours
| 03/02 | 04/02 | 05/02 | 06/02 | 09/02 | Date |
|---|---|---|---|---|---|
| 0.4861(c) | 0.4874(c) | 0.4975(c) | 0.4851(c) | 0.4851 | Dernier |
| +0.56 % | +0.27 % | +2.07 % | -2.49 % | 0.00 % | Var. |
| 0.4755 | 0.4836 | 0.4878 | 0.4981 | 0.4791 | Ouv. |
| 0.4882 | 0.4884 | 0.5018 | 0.4995 | 0.4851 | + Haut |
| 0.4730 | 0.4800 | 0.4878 | 0.4840 | 0.4780 | + Bas |
| 0.4902 | 0.4897 | 0.4896 | 0.4896 | 0.4898 | MM20 |
| 0.5148 | 0.5131 | 0.5117 | 0.5102 | 0.5091 | MM50 |
| 0.5358 | 0.5346 | 0.5337 | 0.5325 | 0.5313 | MM100 |
Produit
Trackers
Type de produit
Short
Sous-jacent
DOW JONES EURO S…
Type de sous-jacent
-
Emetteur
SGAM
Portefeuille Trading
+336.70 % vs +66.82 % pour le CAC 40
Performance depuis le 28 mai 2008


