


chiffres clés
Ouverture :
-
+ Haut :
-
+ Bas :
-
Perf Ouverture :
-
Clôture veille :
52.6600 €
Volume :
-
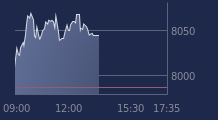
Graphique LYXOR ETF ASIP EXJ sur 5 jours
Cours LYXOR ETF ASIP EXJ sur 5 jours
| 13/05 | 14/05 | 15/05 | 18/05 | 19/05 | Date |
|---|---|---|---|---|---|
| - | - | - | - | - | Dernier |
| - | - | - | - | - | Var. |
| - | - | - | - | - | Ouv. |
| - | - | - | - | - | + Haut |
| - | - | - | - | - | + Bas |
| - | - | - | - | - | MM20 |
| - | - | - | - | - | MM50 |
| - | - | - | - | - | MM100 |
Produit
Trackers
Type de produit
Regions
Sous-jacent
MSCI AC ASIA-PAC…
Type de sous-jacent
-
Emetteur
LYXOR ASSET MANAGEMENT
Portefeuille Trading
+330.00 % vs +61.81 % pour le CAC 40
Performance depuis le 28 mai 2008