


chiffres clés
Ouverture :
3.410 €
Perf Ouverture :
-0.29 %
+ Haut :
3.420 €
+ Bas :
3.400 €
Clôture veille :
3.420 €
Volume :
52
Capi échangé :
+0.00 %
Capi :
10 M€
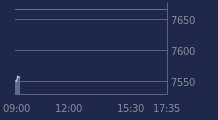
Graphique KUMULUS VAPE sur 5 jours
Cours KUMULUS VAPE sur 5 jours
| 17/03 | 18/03 | 19/03 | 20/03 | 23/03 | Date |
|---|---|---|---|---|---|
| 3.440(c) | 3.370(c) | 3.330(c) | 3.420(c) | 3.400 | Dernier |
| -1.71 % | -2.03 % | -1.19 % | +2.70 % | -0.58 % | Var. |
| 250 | 95 | 842 | 598 | 52 | Volume |
| 3.490 | 3.430 | 3.380 | 3.340 | 3.410 | Ouv. |
| 3.590 | 3.440 | 3.440 | 3.520 | 3.420 | + Haut |
| 3.440 | 3.370 | 3.320 | 3.340 | 3.400 | + Bas |
| 3.530 | 3.509 | 3.487 | 3.469 | 3.450 | MM20 |
| 3.774 | 3.759 | 3.744 | 3.729 | 3.717 | MM50 |
| 3.883 | 3.877 | 3.871 | 3.866 | 3.861 | MM100 |
Performances historiques KUMULUS VAPE
| 5 jours | 1 mois | 1er janvier | 5 ans |
|---|---|---|---|
| -2.86 % | -10.05 % | -13.92 % | -59.52 % |
Court terme
Baissière
Moyen terme
Baissière
Long terme
Baissière
Pas de conseil sur cette valeur
Portefeuille Trading
+336.60 % vs +51.76 % pour le CAC 40
Performance depuis le 28 mai 2008