


chiffres clés
Ouverture :
20.8420 €
+ Haut :
20.9200 €
+ Bas :
20.8420 €
Perf Ouverture :
+0.30 %
Clôture veille :
20.8510 €
Volume :
994
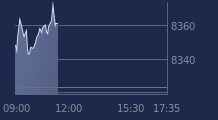
Graphique ISHARES PROP ASIA sur 5 jours
Cours ISHARES PROP ASIA sur 5 jours
| 04/02 | 05/02 | 06/02 | 09/02 | 10/02 | Date |
|---|---|---|---|---|---|
| 20.6020(c) | 20.5660(c) | 20.5790(c) | 20.8510(c) | 20.9050 | Dernier |
| +0.84 % | -0.17 % | +0.06 % | +1.32 % | +0.26 % | Var. |
| 20.5630 | 20.6970 | 20.5220 | 20.7290 | 20.8420 | Ouv. |
| 20.6020 | 20.6970 | 20.6990 | 20.8510 | 20.9200 | + Haut |
| 20.5410 | 20.5190 | 20.4840 | 20.6960 | 20.8420 | + Bas |
| 20.3766 | 20.3886 | 20.3961 | 20.4172 | 20.4450 | MM20 |
| 20.0273 | 20.0403 | 20.0525 | 20.0692 | 20.0847 | MM50 |
| 19.9201 | 19.9246 | 19.9322 | 19.9426 | 19.9529 | MM100 |
Produit
Trackers
Type de produit
Real Estate
Sous-jacent
FTSE EPRA/NAREIT…
Type de sous-jacent
-
Emetteur
BARCLAYS GLOBAL INVESTORS
Portefeuille Trading
+336.50 % vs +68.25 % pour le CAC 40
Performance depuis le 28 mai 2008