


chiffres clés
Ouverture :
31.9000 €
+ Haut :
31.9400 €
+ Bas :
31.9000 €
Perf Ouverture :
0.00 %
Clôture veille :
31.8000 €
Volume :
2 511
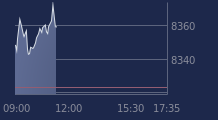
Graphique ISHARES INFRA GLO sur 5 jours
Cours ISHARES INFRA GLO sur 5 jours
| 04/02 | 05/02 | 06/02 | 09/02 | 10/02 | Date |
|---|---|---|---|---|---|
| 31.8500(c) | 31.8050(c) | 31.8850(c) | 31.8000(c) | 31.9000 | Dernier |
| +1.27 % | -0.14 % | +0.25 % | -0.27 % | +0.31 % | Var. |
| 31.5000 | 31.7950 | 31.9800 | 31.9450 | 31.9000 | Ouv. |
| 31.8750 | 31.8600 | 32.1400 | 31.9450 | 31.9400 | + Haut |
| 31.5000 | 31.7500 | 31.8850 | 31.6550 | 31.9000 | + Bas |
| 30.8603 | 30.9287 | 30.9912 | 31.0662 | 31.1455 | MM20 |
| 30.6080 | 30.6303 | 30.6512 | 30.6666 | 30.6831 | MM50 |
| 30.5982 | 30.6192 | 30.6448 | 30.6684 | 30.6930 | MM100 |
Produit
Trackers
Type de produit
Infrastructure
Sous-jacent
FTSE/MACQUARIE G…
Type de sous-jacent
-
Emetteur
BARCLAYS GLOBAL INVESTORS
Portefeuille Trading
+336.50 % vs +68.19 % pour le CAC 40
Performance depuis le 28 mai 2008