


chiffres clés
Ouverture :
-
+ Haut :
-
+ Bas :
-
Perf Ouverture :
-
Clôture veille :
23.3950 €
Volume :
-
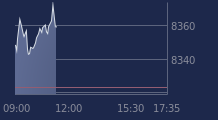
Graphique ISHARES ASIA PACIF sur 5 jours
Cours ISHARES ASIA PACIF sur 5 jours
| 04/02 | 05/02 | 06/02 | 09/02 | 10/02 | Date |
|---|---|---|---|---|---|
| - | - | - | - | - | Dernier |
| - | - | - | - | - | Var. |
| - | - | - | - | - | Ouv. |
| - | - | - | - | - | + Haut |
| - | - | - | - | - | + Bas |
| - | - | - | - | - | MM20 |
| - | - | - | - | - | MM50 |
| - | - | - | - | - | MM100 |
Produit
Trackers
Type de produit
Select Dividend
Sous-jacent
DOW JONES ASIA/P…
Type de sous-jacent
-
Emetteur
BARCLAYS GLOBAL INVESTORS
Portefeuille Trading
+336.50 % vs +68.19 % pour le CAC 40
Performance depuis le 28 mai 2008