


chiffres clés
Ouverture :
0.178 €
Perf Ouverture :
-1.91 %
+ Haut :
0.178 €
+ Bas :
0.167 €
Clôture veille :
0.175 €
Volume :
14 358
Capi échangé :
+0.01 %
Capi :
25 M€
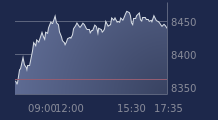
Graphique IMPLANET sur 5 jours
Cours IMPLANET sur 5 jours
| 16/07 | 17/07 | 20/07 | 21/07 | 22/07 | Date |
|---|---|---|---|---|---|
| 0.178(c) | 0.171(c) | 0.166(c) | 0.175(c) | 0.175(c) | Dernier |
| +0.57 % | -3.82 % | -2.92 % | +5.42 % | -0.23 % | Var. |
| 80 196 | 68 837 | 24 253 | 70 680 | 14 358 | Volume |
| 0.177 | 0.179 | 0.171 | 0.170 | 0.178 | Ouv. |
| 0.181 | 0.179 | 0.177 | 0.179 | 0.178 | + Haut |
| 0.171 | 0.169 | 0.164 | 0.169 | 0.167 | + Bas |
| 0.175 | 0.174 | 0.173 | 0.173 | 0.173 | MM20 |
| 0.183 | 0.182 | 0.182 | 0.181 | 0.181 | MM50 |
| 0.197 | 0.197 | 0.196 | 0.196 | 0.196 | MM100 |
Performances historiques IMPLANET
| 5 jours | 1 mois | 1er janvier | 5 ans |
|---|---|---|---|
| -1.24 % | -5.62 % | -12.04 % | -77.76 % |
Court terme
Baissière
Moyen terme
Baissière
Long terme
Baissière
Pas de conseil sur cette valeur
Portefeuille Trading
+319.20 % vs +69.74 % pour le CAC 40
Performance depuis le 28 mai 2008