


chiffres clés
Ouverture :
51.200 €
Perf Ouverture :
-1.56 %
+ Haut :
51.600 €
+ Bas :
50.400 €
Clôture veille :
51.200 €
Volume :
305
Capi échangé :
+0.00 %
Capi :
380 M€
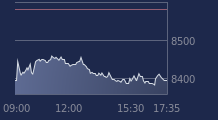
Graphique IMMOB.DASSAULT sur 5 jours
Cours IMMOB.DASSAULT sur 5 jours
| 24/02 | 25/02 | 26/02 | 27/02 | 02/03 | Date |
|---|---|---|---|---|---|
| 50.800(c) | 51.000(c) | 51.200(c) | 51.200(c) | 50.400(c) | Dernier |
| +0.79 % | +0.39 % | +0.39 % | 0.00 % | -1.56 % | Var. |
| 405 | 275 | 22 | 54 | 305 | Volume |
| 50.200 | 50.600 | 51.200 | 51.200 | 51.200 | Ouv. |
| 50.800 | 51.400 | 51.200 | 51.200 | 51.600 | + Haut |
| 50.000 | 50.600 | 50.800 | 51.000 | 50.400 | + Bas |
| 50.780 | 50.840 | 50.860 | 50.910 | 50.920 | MM20 |
| 50.910 | 50.894 | 50.882 | 50.902 | 50.920 | MM50 |
| 50.507 | 50.491 | 50.481 | 50.483 | 50.465 | MM100 |
Performances historiques IMMOB.DASSAULT
| 5 jours | 1 mois | 1er janvier | 5 ans |
|---|---|---|---|
| 0.00 % | +0.40 % | -2.70 % | -11.89 % |
Court terme
Neutre
Moyen terme
Haussière
Long terme
Neutre
Portefeuille Trading
+333.50 % vs +68.86 % pour le CAC 40
Performance depuis le 28 mai 2008