


chiffres clés
Ouverture :
4.700 €
Perf Ouverture :
+3.51 %
+ Haut :
4.925 €
+ Bas :
4.700 €
Clôture veille :
4.720 €
Volume :
15 319
Capi échangé :
+0.09 %
Capi :
80 M€
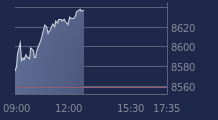
Graphique HOFFMANN Green Cement sur 5 jours
Cours HOFFMANN Green Cement sur 5 jours
| 20/02 | 23/02 | 24/02 | 25/02 | 26/02 | Date |
|---|---|---|---|---|---|
| 4.700(c) | 4.700(c) | 4.720(c) | 4.720(c) | 4.865 | Dernier |
| -2.79 % | 0.00 % | +0.43 % | 0.00 % | +3.07 % | Var. |
| 23 699 | 14 750 | 9 376 | 5 485 | 15 319 | Volume |
| 4.800 | 4.760 | 4.700 | 4.720 | 4.700 | Ouv. |
| 4.840 | 4.790 | 4.745 | 4.750 | 4.925 | + Haut |
| 4.645 | 4.625 | 4.675 | 4.650 | 4.700 | + Bas |
| 4.810 | 4.808 | 4.804 | 4.805 | 4.799 | MM20 |
| 4.482 | 4.490 | 4.500 | 4.510 | 4.523 | MM50 |
| 4.314 | 4.316 | 4.318 | 4.321 | 4.325 | MM100 |
Performances historiques HOFFMANN Green Cement
| 5 jours | 1 mois | 1er janvier | 5 ans |
|---|---|---|---|
| +0.62 % | +7.04 % | +26.36 % | -85.94 % |
Court terme
Haussière
Moyen terme
Haussière
Long terme
Haussière
Pas de conseil sur cette valeur
Portefeuille Trading
+335.70 % vs +73.71 % pour le CAC 40
Performance depuis le 28 mai 2008