


chiffres clés
Ouverture :
18.150 €
Perf Ouverture :
-0.83 %
+ Haut :
18.150 €
+ Bas :
18.000 €
Clôture veille :
18.150 €
Volume :
696
Capi échangé :
+0.01 %
Capi :
173 M€
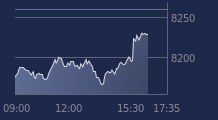
Graphique GROUPE PARTOUCHE sur 5 jours
Cours GROUPE PARTOUCHE sur 5 jours
| 07/04 | 08/04 | 09/04 | 10/04 | 13/04 | Date |
|---|---|---|---|---|---|
| 17.800(c) | 18.050(c) | 18.150(c) | 18.150(c) | 18.000 | Dernier |
| 0.00 % | +1.40 % | +0.55 % | 0.00 % | -0.83 % | Var. |
| 412 | 793 | 715 | 76 | 696 | Volume |
| 17.900 | 17.800 | 18.050 | 18.200 | 18.150 | Ouv. |
| 17.900 | 18.050 | 18.600 | 18.200 | 18.150 | + Haut |
| 17.750 | 17.800 | 18.050 | 18.150 | 18.000 | + Bas |
| 18.008 | 18.018 | 18.033 | 18.033 | 18.025 | MM20 |
| 18.022 | 17.995 | 17.966 | 17.970 | 17.971 | MM50 |
| 17.994 | 17.994 | 17.995 | 17.997 | 17.998 | MM100 |
Performances historiques GROUPE PARTOUCHE
| 5 jours | 1 mois | 1er janvier | 5 ans |
|---|---|---|---|
| +1.12 % | -0.83 % | 0.00 % | -22.75 % |
Court terme
Haussière
Moyen terme
Haussière
Long terme
Haussière
Pas de conseil sur cette valeur
Portefeuille Trading
+332.70 % vs +65.58 % pour le CAC 40
Performance depuis le 28 mai 2008