


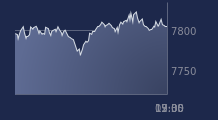
chiffres clés
Ouverture :
14.600 €
Perf Ouverture :
+2.19 %
+ Haut :
15.000 €
+ Bas :
14.400 €
Clôture veille :
14.560 €
Volume :
55 008
Capi échangé :
+1.04 %
Capi :
79 M€
Graphique FRANCAISE DE L'ENERGIE sur 5 jours
Cours FRANCAISE DE L'ENERGIE sur 5 jours
| 05/10 | 06/10 | 07/10 | 08/10 | 09/10 | Date |
|---|---|---|---|---|---|
| 18.100(c) | 17.860(c) | 14.480(c) | 14.560(c) | 14.920(c) | Dernier |
| +1.91 % | -1.33 % | -18.92 % | +0.55 % | +2.47 % | Var. |
| 27 803 | 57 795 | 199 616 | 137 314 | 55 008 | Volume |
| 17.760 | 17.920 | 15.680 | 14.200 | 14.600 | Ouv. |
| 18.320 | 18.200 | 16.000 | 14.880 | 15.000 | + Haut |
| 17.400 | 16.880 | 14.120 | 13.240 | 14.400 | + Bas |
| 20.886 | 20.542 | 20.116 | 19.756 | 19.347 | MM20 |
| 25.838 | 25.620 | 25.359 | 25.086 | 24.821 | MM50 |
| 31.911 | 31.734 | 31.519 | 31.306 | 31.075 | MM100 |
Performances historiques FRANCAISE DE L'ENERGIE
| 5 jours | 1 mois | 1er janvier | 5 ans |
|---|---|---|---|
| -15.99 % | -39.72 % | -53.01 % | -29.95 % |
Court terme
Baissière
Moyen terme
Baissière
Long terme
Baissière
Portefeuille Trading
+315.70 % vs +56.97 % pour le CAC 40
Performance depuis le 28 mai 2008