


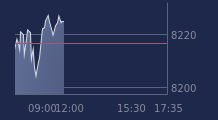
chiffres clés
Ouverture :
15.740 €
Perf Ouverture :
-2.03 %
+ Haut :
16.460 €
+ Bas :
15.340 €
Clôture veille :
17.040 €
Volume :
125 776
Capi échangé :
+0.88 %
Capi :
221 M€
Graphique EVS BROADC.EQUIPM. sur 5 jours
Cours EVS BROADC.EQUIPM. sur 5 jours
| 12/11 | 13/11 | 16/11 | 17/11 | 18/11 | Date |
|---|---|---|---|---|---|
| 17.720(c) | 17.540(c) | 17.220(c) | 17.040(c) | 15.420 | Dernier |
| -6.04 % | -1.02 % | -1.82 % | -1.05 % | -9.51 % | Var. |
| 75 516 | 33 610 | 38 621 | 59 922 | 125 776 | Volume |
| 18.740 | 17.700 | 17.540 | 17.000 | 15.740 | Ouv. |
| 18.840 | 17.780 | 17.660 | 17.340 | 16.460 | + Haut |
| 17.680 | 17.340 | 17.140 | 16.860 | 15.340 | + Bas |
| 18.203 | 18.106 | 18.011 | 17.916 | 17.773 | MM20 |
| 22.651 | 22.418 | 22.184 | 21.952 | 21.689 | MM50 |
| 25.310 | 25.208 | 25.106 | 25.003 | 24.879 | MM100 |
Performances historiques EVS BROADC.EQUIPM.
| 5 jours | 1 mois | 1er janvier | 5 ans |
|---|---|---|---|
| -18.24 % | -20.84 % | -58.15 % | -27.44 % |
Court terme
Baissière
Moyen terme
Baissière
Long terme
Baissière
Pas de conseil sur cette valeur
Portefeuille Trading
+316.30 % vs +65.48 % pour le CAC 40
Performance depuis le 28 mai 2008