


chiffres clés
Ouverture :
1.936 €
Perf Ouverture :
+0.31 %
+ Haut :
1.998 €
+ Bas :
1.934 €
Clôture veille :
1.928 €
Volume :
32 554
Capi échangé :
+0.12 %
Capi :
53 M€
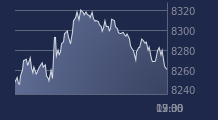
Graphique EKINOPS sur 5 jours
Cours EKINOPS sur 5 jours
| 07/04 | 08/04 | 09/04 | 10/04 | 13/04 | Date |
|---|---|---|---|---|---|
| 1.832(c) | 1.970(c) | 1.928(c) | 1.942(c) | - | Dernier |
| -5.86 % | +7.53 % | -2.13 % | +0.73 % | - | Var. |
| 102 020 | 129 917 | 65 451 | 32 554 | - | Volume |
| 1.960 | 1.940 | 1.990 | 1.936 | - | Ouv. |
| 1.982 | 2.030 | 1.998 | 1.998 | - | + Haut |
| 1.816 | 1.902 | 1.928 | 1.934 | - | + Bas |
| 1.816 | 1.816 | 1.810 | 1.803 | - | MM20 |
| 2.052 | 2.043 | 2.033 | 2.023 | - | MM50 |
| 1.947 | 1.950 | 1.953 | 1.956 | - | MM100 |
Performances historiques EKINOPS
| 5 jours | 1 mois | 1er janvier | 5 ans |
|---|---|---|---|
| -0.21 % | -1.12 % | +0.62 % | -70.80 % |
Court terme
Neutre
Moyen terme
Baissière
Long terme
Neutre
Pas de conseil sur cette valeur
Portefeuille Trading
+332.70 % vs +66.15 % pour le CAC 40
Performance depuis le 28 mai 2008