


chiffres clés
Ouverture :
2.860 €
Perf Ouverture :
0.00 %
+ Haut :
2.860 €
+ Bas :
2.800 €
Clôture veille :
2.860 €
Volume :
251
Capi échangé :
+0.00 %
Capi :
33 M€
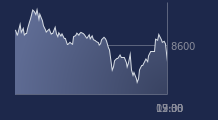
Graphique DAMARTEX sur 5 jours
Cours DAMARTEX sur 5 jours
| 24/02 | 25/02 | 26/02 | 27/02 | 02/03 | Date |
|---|---|---|---|---|---|
| 2.760(c) | 2.820(c) | 2.860(c) | 2.860(c) | - | Dernier |
| 0.00 % | +2.17 % | +1.42 % | 0.00 % | - | Var. |
| 2 573 | 82 | 326 | 251 | - | Volume |
| 2.760 | 2.760 | 2.820 | 2.860 | - | Ouv. |
| 3.000 | 2.820 | 2.860 | 2.860 | - | + Haut |
| 2.760 | 2.760 | 2.800 | 2.800 | - | + Bas |
| 2.808 | 2.792 | 2.783 | 2.775 | - | MM20 |
| 3.062 | 3.058 | 3.058 | 3.057 | - | MM50 |
| 3.378 | 3.369 | 3.361 | 3.352 | - | MM100 |
Performances historiques DAMARTEX
| 5 jours | 1 mois | 1er janvier | 5 ans |
|---|---|---|---|
| +3.62 % | -9.49 % | -16.86 % | -82.87 % |
Court terme
Neutre
Moyen terme
Baissière
Long terme
Baissière
Pas de conseil sur cette valeur
Portefeuille Trading
+334.30 % vs +72.61 % pour le CAC 40
Performance depuis le 28 mai 2008