


chiffres clés
Ouverture :
125.000 €
Perf Ouverture :
+0.03 %
+ Haut :
125.040 €
+ Bas :
124.980 €
Clôture veille :
124.780 €
Volume :
57
Capi échangé :
+0.01 %
Capi :
127 M€
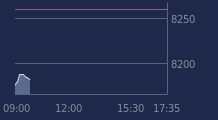
Graphique CRCAM TOURAINE CCI sur 5 jours
Cours CRCAM TOURAINE CCI sur 5 jours
| 07/04 | 08/04 | 09/04 | 10/04 | 13/04 | Date |
|---|---|---|---|---|---|
| 122.740(c) | 126.160(c) | 124.000(c) | 124.780(c) | 125.040 | Dernier |
| -3.93 % | +2.79 % | -1.71 % | +0.63 % | +0.21 % | Var. |
| 897 | 640 | 211 | 47 | 57 | Volume |
| 125.500 | 126.200 | 126.160 | 124.020 | 125.000 | Ouv. |
| 127.980 | 127.360 | 126.160 | 124.980 | 125.040 | + Haut |
| 122.680 | 126.000 | 124.000 | 124.020 | 124.980 | + Bas |
| 124.541 | 124.454 | 124.504 | 124.448 | 124.572 | MM20 |
| 124.336 | 124.309 | 124.359 | 124.424 | 124.482 | MM50 |
| 118.818 | 118.903 | 118.943 | 119.001 | 119.057 | MM100 |
Performances historiques CRCAM TOURAINE CCI
| 5 jours | 1 mois | 1er janvier | 5 ans |
|---|---|---|---|
| -2.13 % | +2.02 % | +12.63 % | +30.40 % |
Court terme
Baissière
Moyen terme
Neutre
Long terme
Haussière
Pas de news sur cette valeur
Portefeuille Trading
+332.70 % vs +64.53 % pour le CAC 40
Performance depuis le 28 mai 2008