


chiffres clés
Ouverture :
184.000 €
Perf Ouverture :
-1.36 %
+ Haut :
187.000 €
+ Bas :
173.000 €
Clôture veille :
184.000 €
Volume :
1 984
Capi échangé :
+0.13 %
Capi :
272 M€
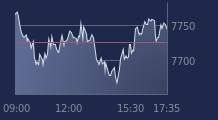
Graphique CAMPINE sur 5 jours
Cours CAMPINE sur 5 jours
| 18/03 | 19/03 | 20/03 | 23/03 | 24/03 | Date |
|---|---|---|---|---|---|
| 192.000(c) | 192.500(c) | 184.500(c) | 184.000(c) | 181.500(c) | Dernier |
| 0.00 % | +0.26 % | -4.16 % | -0.27 % | -1.36 % | Var. |
| 506 | 760 | 293 | 999 | 1 984 | Volume |
| 192.000 | 188.000 | 194.500 | 180.000 | 184.000 | Ouv. |
| 195.000 | 192.500 | 194.500 | 196.000 | 187.000 | + Haut |
| 187.500 | 177.500 | 183.500 | 175.500 | 173.000 | + Bas |
| 190.125 | 189.750 | 188.925 | 188.150 | 186.975 | MM20 |
| 204.660 | 203.970 | 203.220 | 202.500 | 201.550 | MM50 |
| 206.535 | 206.060 | 205.655 | 205.145 | 204.630 | MM100 |
Performances historiques CAMPINE
| 5 jours | 1 mois | 1er janvier | 5 ans |
|---|---|---|---|
| -5.47 % | -9.02 % | -13.57 % | +505.00 % |
Court terme
Neutre
Moyen terme
Baissière
Long terme
Baissière
Pas de conseil sur cette valeur
Portefeuille Trading
+333.90 % vs +55.78 % pour le CAC 40
Performance depuis le 28 mai 2008