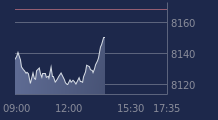
Ouverture :
-
Perf Ouverture :
-
+ Haut :
-
+ Bas :
-
Clôture veille :
2.055 €
Volume :
-
Capi échangé :
0.00 %
Capi :
409 M€
Graphique BPOST sur 5 jours
Cours BPOST sur 5 jours
| 24/12 | 29/12 | 30/12 | 31/12 | 31/12 | Date |
|---|---|---|---|---|---|
| 2.015 | 2.005 | 2.055 | 2.045 | 2.045 | Dernier |
| +1.15 % | -0.50 % | +2.49 % | -0.49 % | 0.00 % | Var. |
| 64093 | 293654 | 401949 | 106161 | Volume | |
| 1.99 | 2.005 | 2 | 2.045 | Ouv. | |
| 2.015 | 2.025 | 2.075 | 2.06 | + Haut | |
| 1.99 | 1.98 | 2 | 2.03 | + Bas | |
| 1.94625 | 1.9534 | 1.96105 | 1.9691 | 1.9691 | MM20 |
| 1.94424 | 1.94114 | 1.93934 | 1.93694 | 1.93694 | MM50 |
| 2.10857 | 2.10652 | 2.10272 | 2.09782 | 2.09782 | MM100 |
Performances historiques BPOST
| 5 jours | 1 mois | 1er janvier | 5 ans |
|---|---|---|---|
| +1.49 % | +7.52 % | +3.81 % | -75.76 % |
Court terme
Haussière
Moyen terme
Neutre
Long terme
Baissière
Pas de conseil sur cette valeur
Portefeuille Trading
+335.00 % vs +63.94 % pour le CAC 40
Performance depuis le 28 mai 2008


