chiffres clés
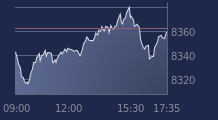
Ouverture :
4.680 €
Perf Ouverture :
+0.09 %
+ Haut :
4.692 €
+ Bas :
4.644 €
Clôture veille :
4.674 €
Volume :
1 517 080
Capi échangé :
+0.05 %
Capi :
13 158 M€
Graphique BOLLORE sur 5 jours
Cours BOLLORE sur 5 jours
| 06/01 | 07/01 | 08/01 | 09/01 | 12/01 | Date |
|---|---|---|---|---|---|
| 4.72 | 4.684 | 4.562 | 4.674 | 4.684 | Dernier |
| -2.72 % | -0.76 % | -2.60 % | +2.46 % | +0.21 % | Var. |
| 1843940 | 1654680 | 1878870 | 1875260 | 1517080 | Volume |
| 4.87 | 4.704 | 4.7 | 4.572 | 4.68 | Ouv. |
| 4.874 | 4.718 | 4.72 | 4.682 | 4.692 | + Haut |
| 4.708 | 4.634 | 4.562 | 4.562 | 4.644 | + Bas |
| 4.6597 | 4.6604 | 4.6559 | 4.6591 | 4.6638 | MM20 |
| 4.69832 | 4.69364 | 4.68832 | 4.68572 | 4.68396 | MM50 |
| 4.78161 | 4.77859 | 4.77421 | 4.77035 | 4.76649 | MM100 |
Performances historiques BOLLORE
| 5 jours | 1 mois | 1er janvier | 5 ans |
|---|---|---|---|
| -3.46 % | +1.08 % | -2.29 % | +39.99 % |
Court terme
Haussière
Moyen terme
Neutre
Long terme
Baissière
Portefeuille Trading
+335.10 % vs +68.15 % pour le CAC 40
Performance depuis le 28 mai 2008


