


chiffres clés
Ouverture :
89.400 €
Perf Ouverture :
+0.67 %
+ Haut :
90.000 €
+ Bas :
88.000 €
Clôture veille :
90.200 €
Volume :
25 158
Capi échangé :
+0.02 %
Capi :
10 653 M€
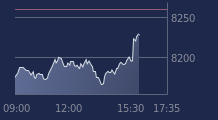
Graphique BIOMERIEUX sur 5 jours
Cours BIOMERIEUX sur 5 jours
| 07/04 | 08/04 | 09/04 | 10/04 | 13/04 | Date |
|---|---|---|---|---|---|
| 91.500(c) | 92.650(c) | 89.550(c) | 90.200(c) | 90.000 | Dernier |
| -2.30 % | +1.26 % | -3.35 % | +0.73 % | -0.22 % | Var. |
| 111 858 | 119 921 | 118 443 | 141 543 | 25 158 | Volume |
| 93.750 | 94.250 | 92.400 | 89.350 | 89.400 | Ouv. |
| 94.400 | 94.650 | 92.700 | 90.900 | 90.000 | + Haut |
| 91.150 | 92.500 | 89.400 | 89.350 | 88.000 | + Bas |
| 92.465 | 92.328 | 92.053 | 91.863 | 91.645 | MM20 |
| 94.767 | 94.556 | 94.307 | 94.125 | 93.970 | MM50 |
| 101.328 | 101.169 | 100.982 | 100.808 | 100.644 | MM100 |
Performances historiques BIOMERIEUX
| 5 jours | 1 mois | 1er janvier | 5 ans |
|---|---|---|---|
| -3.90 % | -4.61 % | -18.40 % | -19.54 % |
Court terme
Baissière
Moyen terme
Baissière
Long terme
Baissière
Portefeuille Trading
+332.70 % vs +65.30 % pour le CAC 40
Performance depuis le 28 mai 2008