


chiffres clés
Ouverture :
6.060 €
Perf Ouverture :
-0.99 %
+ Haut :
6.100 €
+ Bas :
6.000 €
Clôture veille :
6.020 €
Volume :
106 636
Capi échangé :
+0.13 %
Capi :
497 M€
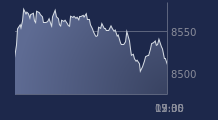
Graphique BENETEAU sur 5 jours
Cours BENETEAU sur 5 jours
| 28/07 | 29/07 | 30/07 | 31/07 | 03/08 | Date |
|---|---|---|---|---|---|
| 5.940(c) | 5.920(c) | 6.020(c) | 6.000(c) | - | Dernier |
| -3.10 % | -0.34 % | +1.69 % | -0.33 % | - | Var. |
| 238 460 | 108 965 | 125 967 | 106 636 | - | Volume |
| 6.080 | 5.950 | 5.910 | 6.060 | - | Ouv. |
| 6.130 | 6.010 | 6.100 | 6.100 | - | + Haut |
| 5.870 | 5.800 | 5.900 | 6.000 | - | + Bas |
| 6.130 | 6.114 | 6.107 | 6.095 | - | MM20 |
| 6.506 | 6.485 | 6.466 | 6.446 | - | MM50 |
| 6.714 | 6.703 | 6.695 | 6.685 | - | MM100 |
Performances historiques BENETEAU
| 5 jours | 1 mois | 1er janvier | 5 ans |
|---|---|---|---|
| -1.80 % | -7.98 % | -27.75 % | -56.46 % |
Court terme
Baissière
Moyen terme
Baissière
Long terme
Baissière
Pas de conseil sur cette valeur
Portefeuille Trading
+321.90 % vs +71.18 % pour le CAC 40
Performance depuis le 28 mai 2008