


chiffres clés
Ouverture :
2.300 €
Perf Ouverture :
+1.74 %
+ Haut :
2.350 €
+ Bas :
2.260 €
Clôture veille :
2.300 €
Volume :
10 919
Capi échangé :
+0.16 %
Capi :
16 M€
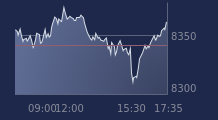
Graphique ARTMARKET COM sur 5 jours
Cours ARTMARKET COM sur 5 jours
| 16/07 | 17/07 | 20/07 | 21/07 | 22/07 | Date |
|---|---|---|---|---|---|
| 2.300(c) | 2.350(c) | 2.300(c) | 2.340(c) | - | Dernier |
| +6.48 % | +2.17 % | -2.13 % | +1.74 % | - | Var. |
| 18 212 | 14 420 | 9 991 | 10 919 | - | Volume |
| 2.170 | 2.320 | 2.300 | 2.300 | - | Ouv. |
| 2.370 | 2.370 | 2.300 | 2.350 | - | + Haut |
| 2.100 | 2.200 | 2.230 | 2.260 | - | + Bas |
| 2.115 | 2.119 | 2.127 | 2.136 | - | MM20 |
| 2.489 | 2.476 | 2.462 | 2.449 | - | MM50 |
| 2.705 | 2.700 | 2.693 | 2.686 | - | MM100 |
Performances historiques ARTMARKET COM
| 5 jours | 1 mois | 1er janvier | 5 ans |
|---|---|---|---|
| +13.04 % | +3.08 % | -33.90 % | -55.34 % |
Court terme
Haussière
Moyen terme
Neutre
Long terme
Baissière
Pas de conseil sur cette valeur
Portefeuille Trading
+318.60 % vs +68.23 % pour le CAC 40
Performance depuis le 28 mai 2008