


chiffres clés
Ouverture :
0.656 €
Perf Ouverture :
-1.68 %
+ Haut :
0.656 €
+ Bas :
0.630 €
Clôture veille :
0.645 €
Volume :
25 040
Capi échangé :
+0.03 %
Capi :
47 M€
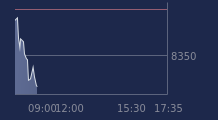
Graphique AB SCIENCE sur 5 jours
Cours AB SCIENCE sur 5 jours
| 10/07 | 13/07 | 14/07 | 15/07 | 16/07 | Date |
|---|---|---|---|---|---|
| 0.733(c) | 0.693(c) | 0.640(c) | 0.645(c) | 0.645 | Dernier |
| -2.27 % | -5.46 % | -7.65 % | +0.78 % | 0.00 % | Var. |
| 144 000 | 421 843 | 734 954 | 753 420 | 25 040 | Volume |
| 0.732 | 0.720 | 0.690 | 0.628 | 0.656 | Ouv. |
| 0.743 | 0.725 | 0.694 | 0.674 | 0.656 | + Haut |
| 0.730 | 0.682 | 0.638 | 0.608 | 0.630 | + Bas |
| 0.828 | 0.818 | 0.807 | 0.795 | 0.785 | MM20 |
| 0.903 | 0.897 | 0.890 | 0.883 | 0.876 | MM50 |
| 1.063 | 1.057 | 1.050 | 1.043 | 1.036 | MM100 |
Performances historiques AB SCIENCE
| 5 jours | 1 mois | 1er janvier | 5 ans |
|---|---|---|---|
| -14.00 % | -27.36 % | -58.01 % | -94.58 % |
Court terme
Baissière
Moyen terme
Baissière
Long terme
Baissière
Pas de conseil sur cette valeur
Portefeuille Trading
+319.50 % vs +67.54 % pour le CAC 40
Performance depuis le 28 mai 2008